
A closed ticket isn’t the same as a business result. To understand how to measure IT support performance, start with 3 to 4 core metrics that show efficiency, staff productivity, work quality and progress towards business goals. The aim is to see whether support helps people work effectively, not just how quickly tickets are closed.
It’s easy to focus on response times and resolution rates because they’re straightforward to track. But figures need context: a fast fix may not last, and a high ticket volume may point to recurring problems disrupting staff and customers.
This article explains how to choose useful measures, assess technician time and service quality, and set clear targets linked to business value. You’ll also learn how to review results regularly, identify strengths, address recurring issues and make informed decisions about where support can have the greatest impact.
Key Takeaways
- Track a small set of support measures that connect response and resolution to business continuity, not just ticket volume.
- Use technician utilisation as one indicator of how staff time is spent, while balancing efficiency with service quality.
- Gather concise post-incident feedback to uncover issues that ticket data alone may miss.
- Set measurable support goals that align with business priorities, then review progress regularly and adjust where needed.
1. Efficiency and effectiveness as performance indicators
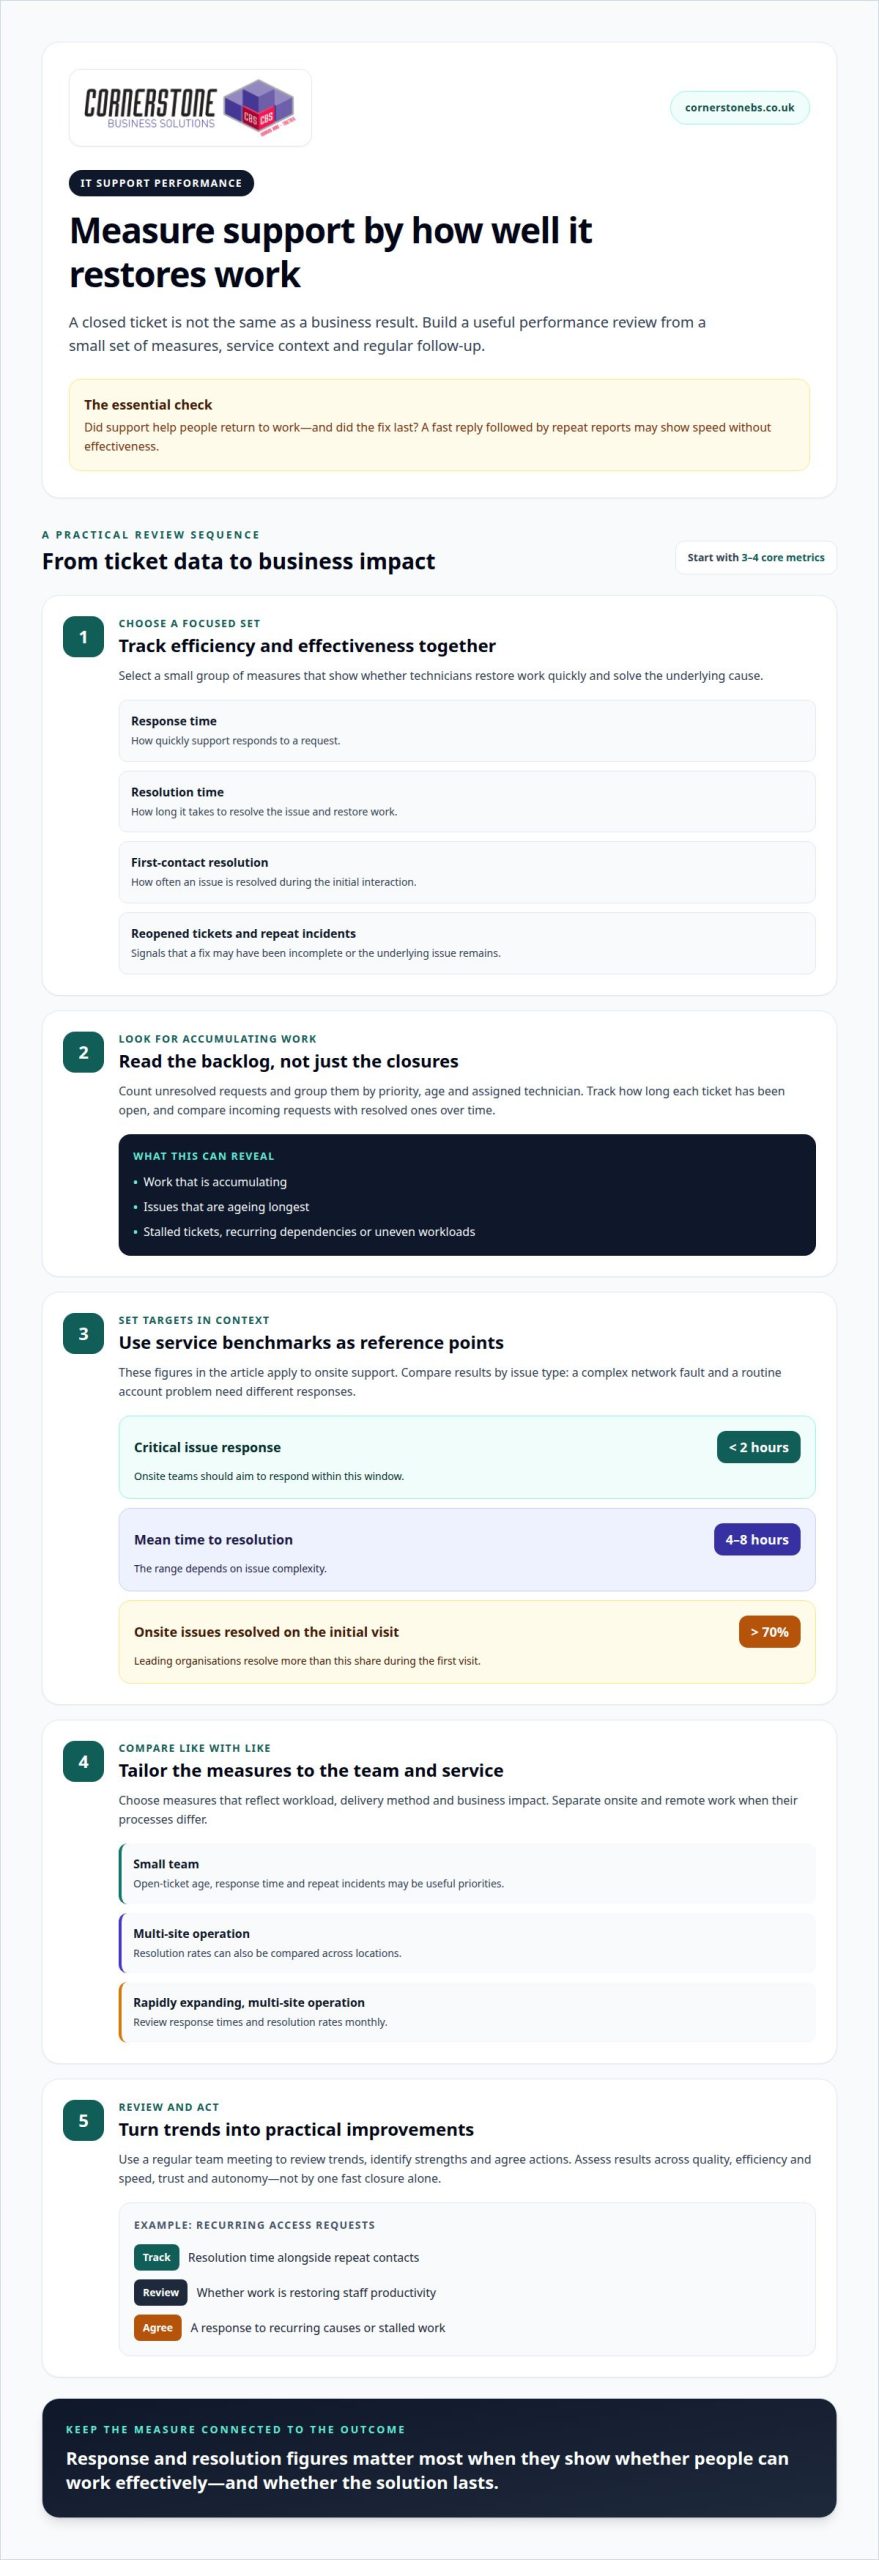
Measure efficiency using response time, resolution time, first-contact resolution and reopened tickets. Together, these metrics show whether technicians restore work quickly and solve the underlying cause, rather than closing tickets prematurely. A quick reply followed by repeat reports, for example, may indicate speed without effectiveness. Link each measure to a business outcome, such as an employee returning to customer work or a production process restarting.
Measure the ticket backlog by counting unresolved requests and grouping them by priority, age and assigned technician. Track how long each ticket has been open and compare incoming requests with resolved ones over time. This shows whether work is accumulating and which issues are ageing longest. A weekly review can flag stalled tickets, recurring dependencies or uneven workloads before they affect productivity.
Use service targets to assess speed in context. Onsite IT support teams should aim to respond to critical issues in under 2 hours, while mean time to resolution typically ranges from 4 to 8 hours, depending on complexity. Leading organisations resolve more than 70% of onsite issues during the initial visit. Compare results by issue type, because a complex network fault and a routine account problem need different responses.
Tailor performance metrics to team size and service type, choosing measures that reflect workload, delivery method and business impact. A small team might focus on open-ticket age, response time and repeat incidents; a multi-site operation may also compare resolution rates across locations. Rapidly expanding multi-site operations should review response times and resolution rates monthly. Track onsite and remote work separately when their processes differ.
Start with 3 to 4 core metrics, then use a regular meeting to review trends and agree actions. For an employee handling recurring access requests, for example, track resolution time alongside repeat contacts. Assess performance across quality, efficiency and speed, and trust and autonomy. Team reviews can then identify strengths to build on and areas needing attention, without treating a single fast closure as proof of effective support.
2. Productivity and profitable use of staff time
Productivity measures what a support team completes with its available time. Timesheets can show how employees divide their hours between customers, projects, routine requests and preventable repeat work. Use these records to see where time goes, then compare completed work with its quality. A technician who closes requests quickly but leaves users struggling hasn’t delivered effective productivity.
Technician utilisation of 75% to 85% is considered optimal for most organisations. Treat utilisation as a planning indicator, not a target to maximise: time is also needed for training, documentation and complex investigations. Pair it with resolution quality and reopened requests. This gives employee performance a fuller context and helps reveal whether workloads or processes need improvement.
To calculate cost per ticket, divide the relevant support costs for a period by the tickets resolved during that same period. Compare the result across periods and request types, then investigate changes in light of complexity, repeat work and resolution quality. You can also monitor productivity through completed tasks and time spent, rather than relying on ticket count alone.
A weekly review lasting 15 minutes can help the team spot performance trends early. Discuss where time is being lost, such as repeated password resets or delays waiting for information, and agree one practical action. Measuring employee performance this way turns the meeting into a focused improvement check, rather than a review of numbers without context.
Review performance regularly rather than treating it as a once-a-year task. Combine ongoing feedback with a broad view of output, accuracy, workload and employee development. If an employee completes fewer requests but handles complex incidents well, assess the work’s value and quality before changing targets. When targets are missed, discuss obstacles together and identify suitable training or process changes.
3. Quality of work
Fast support matters only when the fix lasts and lets people work effectively. Measure quality through repeat incidents, reopened tickets, accurate documentation and user feedback. For example, a user reporting the same access fault again may indicate an incomplete fix. Review these measures alongside efficiency so that speed doesn’t outweigh lasting results.
You can assess first-contact resolution by tracking how often issues are resolved during the initial interaction. Apply the same definition across the team, including what counts as an interaction and a resolution. This makes the metric consistent and helps distinguish a genuine first-time fix from a ticket closed before the user can confirm it works.
Ask users about their support experience after an incident. Keep surveys to 3 to 5 questions, covering whether the issue was resolved, how clearly the technician communicated and whether the user can now work. Post-incident surveys should aim for completion rates above 30%. A short survey makes feedback easier to gather and gives managers practical detail for improvement.
Net Promoter Score (NPS) offers another view of user sentiment. Ask users how likely they are to recommend the support team, using a 0 to 10 scale. An IT support NPS above 50 indicates strong user satisfaction; a score below 30 suggests significant improvement needs. Treat the score as a prompt to examine comments and service patterns, not as a substitute for them.
For measuring employee performance fairly, combine user feedback with ticket audits and team discussion. Check whether the fix matched the reported issue, documentation explains the resolution, and any follow-up happened as agreed. A graphic rating scale from 1 to 10 can assess a specific skill, such as troubleshooting or communication. Use clear criteria when setting ratings, and discuss evidence with the employee so they can understand results and achieve consistent quality.
4. Setting clear goals and expectations
Useful KPIs connect support work to what the organisation needs to deliver. Choose measures such as response time, resolution rate, user satisfaction, service availability and SLA compliance. Unlike general metrics, KPIs focus on measures with the greatest effect on organisational progress. Start with a small set that reflects business priorities, then define each measure and how it will be recorded.
Set targets using SMART principles: Specific, Measurable, Achievable, Relevant and Time-bound. For example, an IT team could aim to reduce repeat incidents by improving documentation and reviewing recurring faults. Make the target realistic for the team’s workload and service type. Each employee should understand their contribution, with individual goals aligned to wider organisational objectives.
To measure SLA compliance, compare the support delivered with the response and resolution commitments in the agreed service level. Report how often eligible requests met those commitments, and review exceptions by priority and issue type. Service availability shows how reliably a system or service can be accessed during its defined measurement period. Consider both measures together: a service may meet response targets while users still experience disruption.
Review IT support KPI targets quarterly and conduct a comprehensive review annually. Use the quarterly check to spot changes in workload or business needs; use the annual review to reconsider whether each KPI still supports the organisation’s goals. A strategic plan can use 5-7 clear KPIs, while Objectives and Key Results (OKRs) connect individual objectives and measurable results to broader organisational goals.
Make formal appraisals a two-way conversation, supported by regular check-ins and documented progress. If an employee misses a target, discuss obstacles and agree practical next steps, such as training or a process change. Cornerstone Business Solutions’ Managed IT Support can help businesses align support measures with operational priorities and review where service delivery can improve.
Cornerstone Business Solutions: Managed IT Support
Cornerstone Business Solutions provides Managed IT Support for businesses seeking to connect day-to-day IT performance with operational priorities. When ticket figures alone don’t show whether support is helping staff work effectively, a structured review can bring response trends, recurring issues and service quality into clearer focus.
Clear measures help both sides discuss what’s working, where delays are occurring and which improvements matter most to your organisation. Managed IT Support can also sit alongside Microsoft 365 and Cyber Security needs, keeping the conversation centred on reliable systems and productive teams.
To discuss how your IT support measures relate to business goals, contact Cornerstone Business Solutions.
Make performance measures part of better decisions
Let your measures guide the next decision, rather than simply record what has happened. As business priorities change, revisit the outcomes that matter most and use support trends to shape improvements in continuity, staff experience and technology planning. This keeps how to measure IT support performance connected to the work your organisation needs to do, not just reporting figures.
Cornerstone Business Solutions can help you put that approach into practice through Managed IT Support, alongside Microsoft 365 and Cyber Security. Whether you’re reviewing an existing support arrangement or looking for a clearer link between IT activity and business priorities, a conversation can help identify a useful next step.
Contact Cornerstone Business Solutions to discuss your support goals and how they fit your business. A clearer view of performance can help you make your next IT decision with confidence.
Frequently Asked Questions
And what’s in it for my business?
Measuring support performance helps you see whether IT is protecting productive time and supporting business priorities. Understanding how to measure IT support performance means linking support trends to operational outcomes. For example, tracking repeated access issues that delay a team’s work can help justify a process change. Clear evidence also helps leaders decide where to direct training, resources or technology improvements.
How do you measure the effectiveness of onsite IT support teams?
To assess how to measure IT support performance for onsite teams, check whether technicians restore business operations, resolve the reported cause and leave useful records. After a workstation fault, review whether the employee can complete normal tasks and whether the incident notes explain the fix. Compare results across locations or issue types to identify patterns, such as recurring equipment faults or delays caused by dependencies.
How do you measure user satisfaction with IT support?
Ask users for feedback after receiving support, then look for patterns in their comments. Consider whether they felt listened to, understood the next steps and could return to work. Compare responses by department, location or issue type to find service gaps. A low score in one area may point to a communication problem, even when the technical fix was sound.
What tools help track onsite IT support performance?
A ticketing system can record issue type, priority, assignment, status and resolution notes. Time-tracking tools show how technician effort is distributed, while asset records can link recurring faults to specific equipment. Dashboards make trends easier to discuss, and user feedback adds context to ticket data. Choose tools that produce consistent records, so managers can compare like-for-like work over time.
What are typical IT help desk response and resolution time benchmarks?
For onsite support, teams should aim to respond to standard issues in under 4 hours. Resolution benchmarks depend on the fault’s complexity, parts or access required, and whether other teams need to act. Compare similar incident types rather than judging every ticket against one average. That distinction helps show whether delays reflect avoidable process issues or the nature of the technical problem.
How is customer satisfaction measured in IT support?
Measure customer satisfaction by asking users to rate their experience after an issue is handled, then reviewing written comments for recurring themes. Consider whether users felt informed, whether the outcome met their needs and whether they would use the same process to seek help again. Combining ratings with feedback examples helps explain what drives satisfaction, rather than leaving a score without context.
Tags: business value, It Support, IT support metrics, performance measurement, service desk, service quality, technician productivity